


This post will focus on the frequently overlooked fact that monitoring (like every other system), requires a good understanding of users and goals.
In a modern cloud-native, microservices, container-driven, highly available (insert your favourite catchy word here) application design, monitoring is no longer just an option. In fact, much time is spent arguing about what technology platform best meets these needs.
But, the real question is how do we ensure we have the proper design, regardless of the technology?
This post will focus on the frequently overlooked fact that monitoring (like every other system), requires a good understanding of users and goals. And, like other systems, monitoring has a typical life cycle (Dev, QA, Prod) that, if followed, will improve not only your production but also your software development (DevOps, you know!)
You might also like:
What Does Application Modernization Mean
How to Modernize Applications
Get to know your users
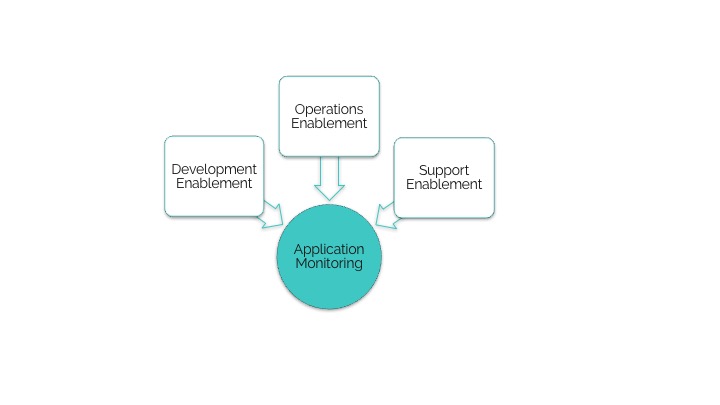
Start by understanding the eco-system in which your monitoring platform will function. Typically, there are 3 audiences that your monitoring system needs to ‘Enable’ (assuming you’re dealing with large enterprise).
Enable your audiences
Your enablement tasks may look something like this:
- Determine your SLIs and SLOs with the project team (Service Level Indicators/Objectives).
- Determine your critical support events (fire alarm type failures)
- Enable the development team to emit events (logging or otherwise) that provide enough information about the SLIs and failure events
- For example, you may enable Spring Boot/Node.js development team to emit the proper event logs needed for your operational alerts. Or, you may build a few libraries and initializers to ensure the effective use of logging.
- Bring in the benefits of automation to enable the operations team to stand up and tear down the monitoring environments effectively (by using scripts/configuration management tools/etc.)
Enable the support engineers to achieve their target SLOs in multiple ways:
- Automatic notifications on certain events (proactive actions)
- Automated response to certain events (when possible to avoid pager fatigue)
- Dashboards to help investigate issues and decrease your MTTR (Mean Time to Resolution/Response)
Integrate monitoring into the project life cycle
In all our applications, there is a version of the ‘login’ screen. A typical flow for a ‘login’ screen story will look like this:

Once we bring the support engineers and monitoring into the discussion, we start asking the question; “what could go wrong here that may require me to alert the administrators or plot on a dashboard for problem resolution?”
Simply asking this question will bring new ideas to the team which could result in a story like this:

By integrating monitoring, operations, and support tasks into our development environment we gain the following:
- The inclusion of exception paths that were not handled at all
- Further enforcement of the “Design for Failure”
- Faster response to problems that would have gone unnoticed or at worse took a longer time to fix.
The Monitoring life cycle
Monitoring solutions involve all parties. This being the case, building a monitoring environment is a great way of breaking down the silos between developers, testers, operations, and support.
As monitoring systems are enabled in each project, and custom dashboards/alerts are being built, deploying these systems in Dev environments means that support and operations teams are brought into the discussion early on.
This helps to evolve the system and integrate learnings from one project to the next.
Not only does this streamline current projects, but it also helps build a “base offering” for new projects, down the road.
Agile still applies here!
Do not let the desire to engineer a great system bait you into the Analysis Paralysis trap. Deploy your first system as soon as possible – with minimal dashboards and features – collect feedback from your audiences, make small changes, and re-deploy.
Learn more:
Digital Transformation: The Human Element
Reducing the Risk of Innovation
Purpose-Driven Agile Engineering
If you do not currently have a monitoring system, almost any first step will improve your ability to respond to production tickets.
My advice? Start somewhere. Keep in mind the “Build to Change” versus the “Build to Last” principal and remember, that “Perfect is the Enemy of Good”.
And, my last piece of advice, anytime I have a choice between an open-source vs. a paid tool, I lean towards the former option (with the exception of hosted tools that may offer fast and easy starting point).
This approach also helps avoid tool lock-in -- tools that require modifying your code against tools that monitor your logs for example.
Monitor the monitors
I don’t mean literally monitor the monitoring systems (and yes, that is a thing!), what I mean is constantly evolve your monitoring solutions.
As time goes by, you will learn that some of the features your audiences asked for are not used anymore or, what’s more, an event may trigger so many times that it is ignored.
Any dashboard that is rarely used or an event that triggers so often it is ignored should always be put up for consideration for change or removal altogether.
Experiences shared by large organizations like Google and some smaller startups, tell us that the smaller and more targeted your monitoring system is, the more useful it becomes.
If you’re interested in learning more or chatting about how monitoring your systems development life cycles (SDLCs) can help you achieve your business goals. We’d love to talk. Reach out to us at info@architech.ca.
Struggling With Proper Execution of Application Development?
[ld_button title="Contact Us" link="url:%2Fcontact-us%2F||target:%20_blank|" color="#3fc8c4" text_color="rgb(0, 0, 0)" el_class="arch-btn"]